Conjuring log-based metrics into a GCP Dashboard
Yesterday, I discovered a delightful trick for conjuring log-based metrics into a GCP Dashboard. And naturally, I’d love to share this strange little magic with you.
Problem statement.
Sometimes your database drops little nuggets of interesting information into its logs—details you might want to surface on your Observability dashboards. Maybe it’s for proactive monitoring, maybe for reactive “oh no, what now?” moments.
I have recently noticed those messages, logged with INFO severity from GCP Cloud for MySql database clients:
2025-11-19T18:52:10.165013Z 1697983 [Note] [MY-010914] [Server] Aborted connection 1697983 to db: 'demodb' user: 'app_reader' host: '108.14.11.3' (Got an error reading communication packets).
2025-11-19T23:14:10.181022Z 1699983 [Note] [MY-010914] [Server] Aborted connection 1699983 to db: 'demodb' user: 'app_reader' host: '108.14.11.24' (Got an error reading communication packets).
2025-11-20T04:55:23.178003Z 1147514 [Note] [MY-010914] [Server] Aborted connection 1147514 to db: 'demodb' user: 'app_reader' host: '108.14.11.24' (Got an error reading communication packets).
What can we do to analyse which clients trigger those log messages?
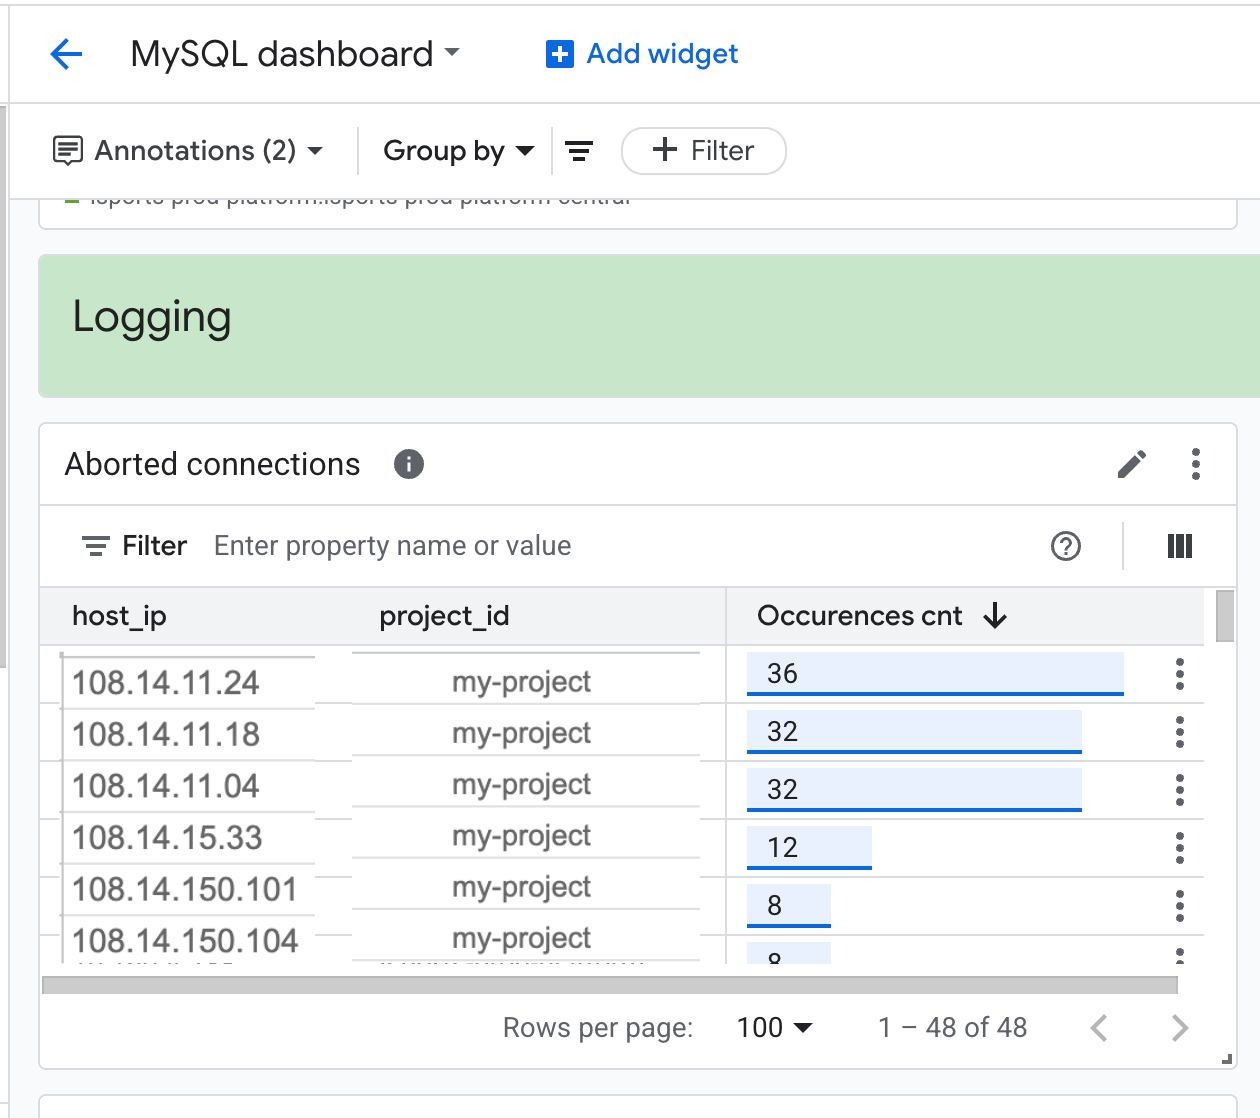
We want to see at any point in time, clients who have timeouts, as in the below visualisation ( and you obviously can do it for any data store logs or any other services logs) :

Here is what needs to be done to create the above dashboard widget
1. Create the Logs-Based Metric
- Go to Cloud Logging > Logs Explorer.
- Write a query that filters for the log entries you are interested in
- In the Logs Explorer page, click on Actions > Create metric.
- Name and describe your new metric.
- In the Label section, you need to extract the client IP address from the log entry textPayload section using a Regular Expression. Here is my RegEx : host:\s*'([0-9]+\.[0-9]+\.[0-9]+\.[0-9]+)'
- Click Create metric. It may take a few minutes for the metric to be ready.
2. Create the Dashboard Widget
- After the metric is created, go to Cloud Monitoring > Dashboards and add a Chart widget.
- Use the Metrics Explorer to select your new Logs-Based Metric. You can then use the Group By and Aggregator settings to count the connections/threads and group them by the new label you created.
- Note that the dashboard widget, by default, applies a rate aggregation to most count-based time-series metrics. This shows the frequency of events instead of the total count. To see the count of occurrences instead of the rate (events/s), you must change the Aggregation settings on the dashboard widget by clicking on the dropdown near “Aggregation” and then on “Configure aligner” to count.

- Save the widget.
Your dashboard will now display all clients that got a timeout, broken down by the client IP address, data that was extracted from the database log.
P.S. If you found this useful, don’t leave me talking to myself — drop a comment and let me know I am not alone in this cosmos :)


Comments
No comments yet.
Leave a comment